
A series of graphs of air quality data in Scotland have been prepared using the latest figures up to and including 2023 and are presented below. This trend analysis summarises how air quality in Scotland has changed over recent years and focuses on pollutants NO2, PM10, PM2.5 and O3.
The trend analysis has been carried out using Openair; the air pollution analytical tool available via the Openair page on this website. The analyses were carried out using the ‘TheilSen’ tool. This uses the Theil-Sen statistical method to determine trends in pollutant concentrations over several years. The trend analysis is based on monthly mean pollutant concentrations. The data used in these trend graphs has been ‘de-seasonalised’ (i.e. the data has been statistically modify to remove the influence of seasonal cycles, thus providing a clearer indication of the overall trend over the relevant time).
In these plots, the trend line is shown by a solid red line, with 95% confidence intervals for the trend shown by dotted red lines. The trend is given at the top of the plot in green, with confidence intervals shown in square brackets. The trend is given as units (i.e. µg m-3) per year, over the period shown. This may be followed by a number of stars:
* indicating that the trend is statistically significant at the 0.05 level
** indicating significance at the 0.01 level and
*** indicating significance at the 0.001 level.
The symbol + indicates that the trend is significant at the 0.1 level.
All the sites featured in this section have been in operation for a minimum of five consecutive years, as this is usually considered to be the minimum required to assess long-term trends at a monitoring site.
Use the links below to navigate to the section you are interested in. Clicking on the graphs will open them in a new window.
- Annual Mean trends for Nitrogen Dioxide (NO2)
- Annual Mean Trends for Particulate Matter (PM10)
- Annual Mean Trends for Particulate Matter as (PM2.5)
- Annual Mean Trends for Ozone (O3)
Further information on air quality trends for a range of pollutants is reported in more detail within the SAQD Annual Report and Local Air Quality Management (LAQM) reports; available on the Technical Reports page.
Annual Mean Trends For Nitrogen Dioxide (NO2)
In Scotland (as elsewhere in the UK), the largest number of AQMAs have been declared in response to exceedances of objectives for nitrogen dioxide (NO2). This is also reflected in the number of monitoring stations reporting exceedances for this pollutant. In particular, the objective of 40 µg m-3 for annual mean NO2 concentration is the most widely exceeded. Therefore, it is important to understand how concentrations of this pollutant vary with time.
NO2 at Urban Background sites
There are relatively few long-running urban background monitoring stations in Scotland. Five urban background sites have been in operation for the past 16 years. These are as follows: Aberdeen Errol Place, Edinburgh St Leonards, Fort William, Glasgow Anderston and Grangemouth. Fort William is classified as a ‘suburban’ site, Grangemouth is an ‘urban industrial’ site, and the other three are ‘urban background’. It should be noted that Aberdeen Errol Place was closed in 2021 and replaced by Aberdeen Errol Park, which is located several meters from the Errol Place sites so considered a new site. We have continued to use Errol place data even though there are no 2022 or 2023 data to show background trends for Urban background locations in the northeast region.
The Openair Theil-Sen function has been used to quantify trends in NO2 at these five urban background monitoring stations, over the period 2007-2023: the trend plots for NO2 are shown in Figure 1. Please note that both Edinburgh St Leonards and Glasgow Anderston have large gaps in their 2014 and 2015 datasets: where there are gaps in the data, Openair fills these in using an interpolation method.
Figure 1 - Trends in NO2 Concentrations at Five Long-Running Urban background sites, 2007-2023
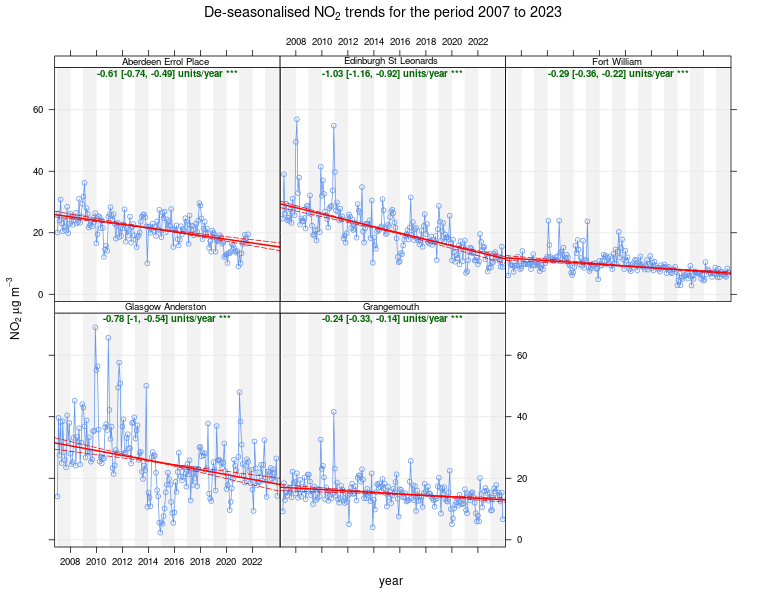
All sites display highly significant decreasing trends (at the 0.001 level) since 2007.
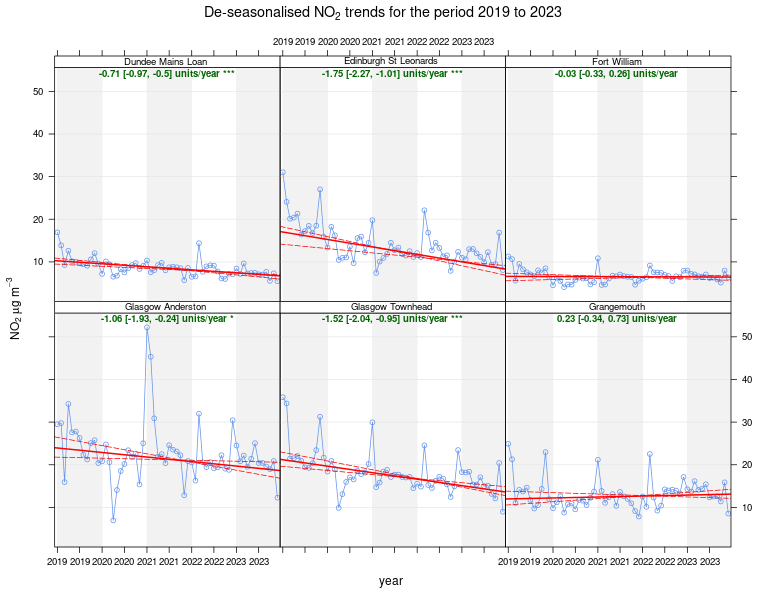
Figure 2 takes into consideration all urban background sites in Scotland over the past five years, including the sites at Dundee Mains Loan and Glasgow Townhead. The more recent years analysis shows that the decreasing trend is consistent with the long-range trend, however the statistical significancy in more variable. The exception to this is Grangemouth where the trend has switched from a highly significant decreasing to and increase trend though not statistically significant.
The impact of the Covid-19 lockdowns was a dramatic decrease in concentrations in the first half of 2020 and early 2021. Concentrations then quickly returned to what could be considered pre-lockdown levels once restrictions were lifted.
Figure 2 - Trends in NO2 Concentrations at All Urban Background sites, 2019-2023
NO2 at Urban Traffic Sites
There are now over 52 urban traffic (roadside and kerbside) monitoring sites that have been in operation for 10 years or more and are still in operation. To identify where these sites are, please go to the Latest & Forecasts page.
This is a large number of long-running sites in operation, therefore we have selected eight sites. These are:
| Aberdeen Union Street | Edinburgh St John’s Road |
| Aberdeen Wellington Road | Glasgow Kerbside (Hope Street) |
| Dundee Lochee Road | North Lanarkshire Chapelhall |
| Dundee Seagate | Perth Atholl Street |
Figure 3 provides the 10-year trend analysis for these selected sites. It shows that all eight sites have statistically highly significant decreasing trends (at the 0.001 level).
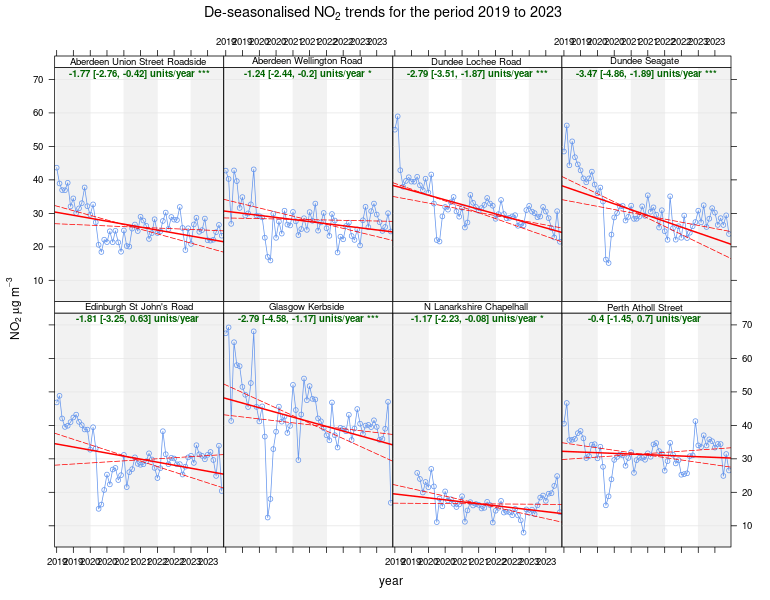
Trends over the most recent five complete years, 2018 – 2023, have also been examined for these sites. These are shown in Figure 4. The analysis shows that the sites are still decreasing, but to a lesser extent across the board.
Figure 3 - Trends in NO2 Concentrations at Eight Long-Running Urban Traffic Sites with Exceedances, 2014-2023
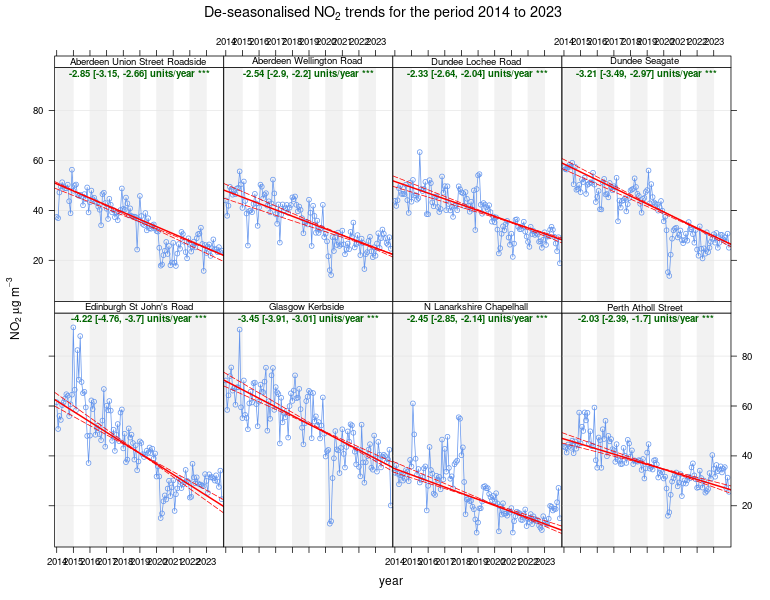
Figure 4 - Recent trends in NO2 Concentration at Eight Long-Running Urban Traffic Sites with Exceedances, 2019-2023
Particulate Matter (PM10 and PM2.5)
This pollutant is of particular interest because:
- Current evidence suggests that there is no safe level of particulate matter in terms of human health effects.
- Scotland’s current annual mean PM10 objective is 18 µg m-3, which is more stringent than the objective of 40 µg m-3 adopted in the rest of the UK.
- In 2016 Scotland opted to make its annual mean PM2.5 objective more stringent, by reducing it from 12 µg m-3 to 10 µg m-3 in line with the World Health Organization guideline.
PM10 at Urban Background Sites
There are now seven urban background sites in Scotland that have been monitoring PM10 for 10 years or longer. These are: Dundee Broughty Ferry Road, Dundee Mains Loan, Edinburgh St Leonards, Glasgow Anderston, Grangemouth, Falkirk Grangemouth MC. Dundee Broughty Ferry Road and Grangemouth are urban industrial; the rest are urban background.
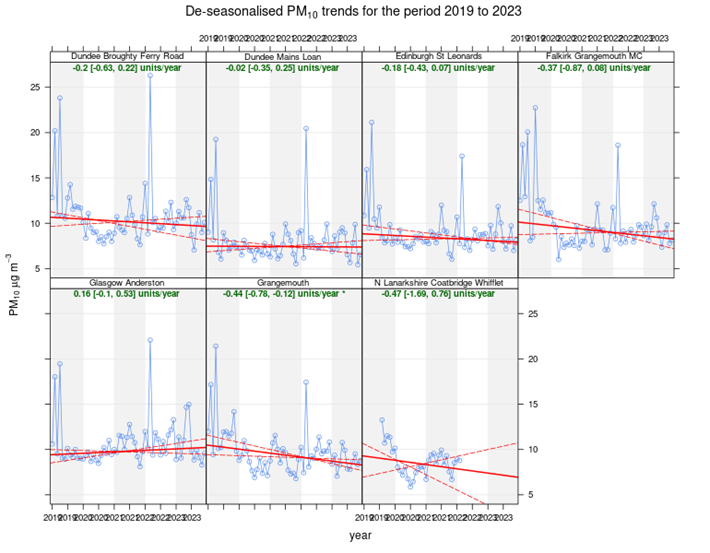
Figure 5 shows trends in de-seasonalised monthly mean PM10 at this subset of long-running sites. All seven sites show statistically highly significant (at the 0.001 level) decreasing trends. Trends in the most recent five years are also examined in Figure 6. Although the decreasing trend is still evident at all sites over the past five years it is no longer highly significant across the board. The exception to this is Glasgow Anderston, which now shows a slight increasing trend with no statistical significancy rather than a decrease trend. This analysis indicates that concentrations have plateaued over recent years at these locations.
Figure 5 - Trends in PM10 Concentration at seven Long-Running Urban Background Sites, 2008–2023
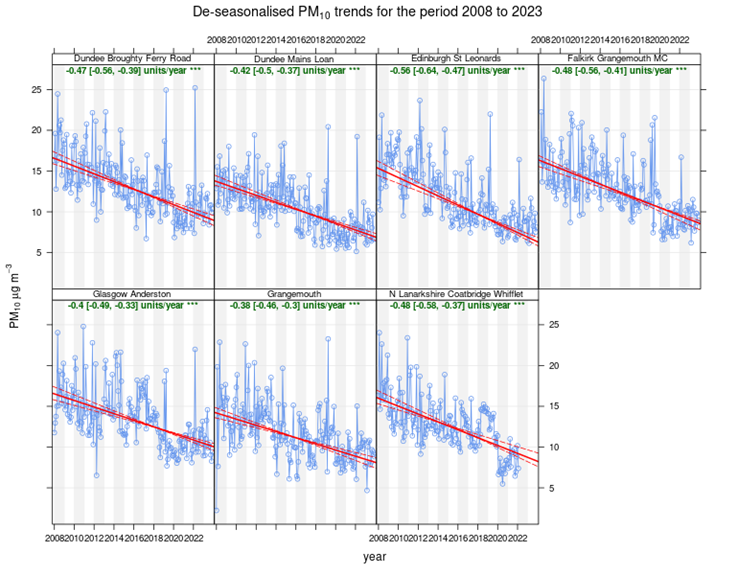
Figure 6 - Trends in PM10 Concentrations at seven long-running Urban Background and Urban Industrial Sites, 2019–2023
PM10 at Urban Traffic Sites
There are 51 PM10 monitoring sites in Scotland that have been monitoring for over 10 years. Trends in de-seasonalised monthly mean PM10 concentrations for eight traffic-related sites in operation since 2014 or earlier are shown in Figure 7. The sites selected for this analysis are Aberdeen Wellington Road, East Dunbartonshire Bearsden, Edinburgh Salamander, Fife Cupar, Glasgow Dumbarton Road, Glasgow Byres Road, Perth Crieff and West Lothian Broxburn. These sites were selected for analysis because of the length of time they have been monitoring (10 years or more), historical exceedances of the annual mean objective and geographical coverage.
All sites showed statistically highly significant decreasing trends (at the 0.001 level), with the exception of Glasgow Byres Road. The analysis indicates that PM10 over the past 10 years is decreasing year on year at all sites except Glasgow Byres Road where analysis shows that concentrations, though fluctuating significantly over the years, have not changed.
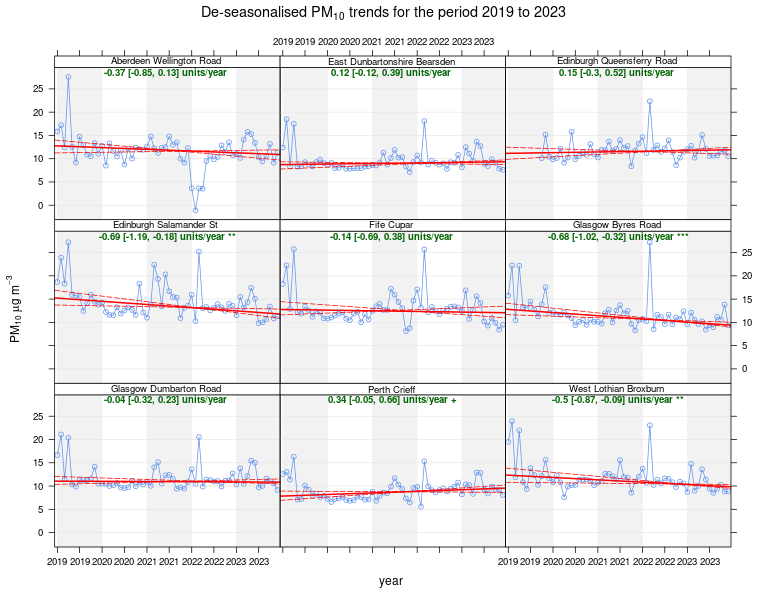
Trends in monthly mean PM10 concentrations for the same eight sites (plus Edinburgh Queensferry Road), for the most recent five complete years 2019 – 2023, are shown in Figure 8. The analysis shows that the decreasing trend is plateauing at a number of sites with varying levels of statistical significancy. At Bearsden, Queensferry road and Crieff the trend is actually increasing over the past 5 years. In contrast to the 10-year analysis, the five-year analysis for Glasgow Byres Road shows that concentrations are now decreasing with high statistical significancy.
Figure 7 - Trends in PM10 Concentrations at eight Long-Running Urban Traffic sites, 2014-2023
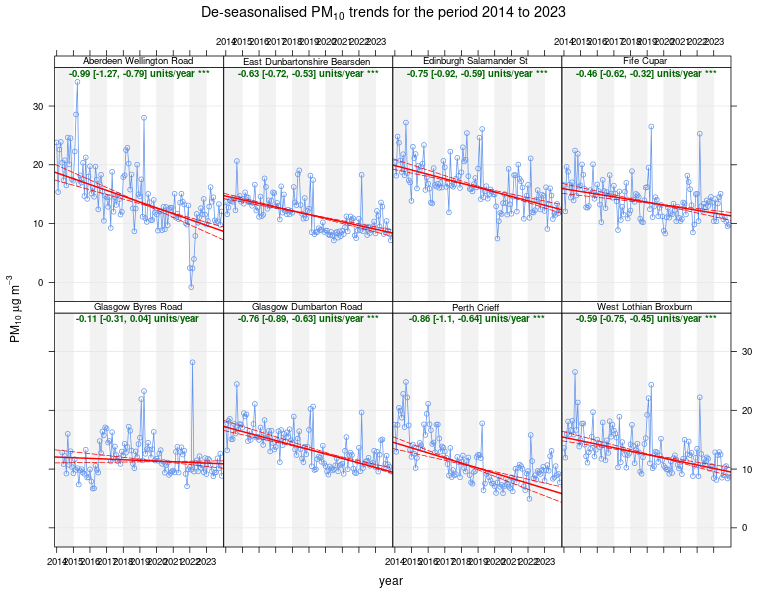
Figure 8 - Trends in PM10 Concentrations at nine Long-Running Urban Traffic sites, 2019-2023
Particulate Matter PM2.5
In earlier years, most monitoring of particulate air pollution was focused on the PM10 size fraction. However, the finer fractions such as PM2.5 are now of more interest in terms of health effects. Fine particles can be carried deep into the lungs where they can cause inflammation and a worsening of the condition of people with heart and lung diseases. They may also carry harmful compounds, adsorbed on their surfaces, into the lungs.
At the time of writing this report there are 84 sites monitoring PM2.5 in Scotland. However, the vast majority of these sites started monitoring in the last six years with the introduction of the PM2.5 objective and the requirement for local authorities to measure the pollutant. By the end of 2023 there were three sites with 10 consecutive years of PM2.5 data. These sites are as follows: Auchencorth Moss (RB), Edinburgh St Leonards (UB), and Grangemouth (UI). The trend plot for these sites is shown in Figure 9.
The analysis shows that Edinburgh St Leonards and Grangemouth have decreasing trends with high statistical significancy over the 10-year time period. Auchencorth Moss, the rural background site, showed less of a decreasing trend with no statistical significancy.
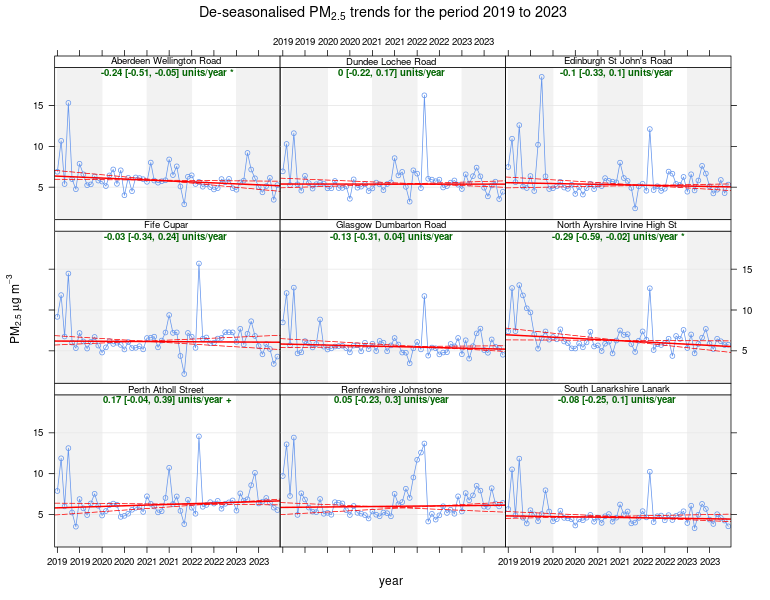
As of the end of 2023, there were an additional 56 sites (all urban traffic) with more than five years’ worth of data, the minimum required for this type of trend analysis. The sites are:
For this report, nine sites that represent a good geographical coverage of Scotland were selected to carry out trend analysis for PM2.5. Figure 10 illustrates the trend for the nine PM2.5 sites selected. As can be seen, all nine sites are very similar with the majority show slight decreasing trends at varying statistical significance. Perth Atholl Street and Renfrewshire Johnston show very slight increasing trends but at no statistical significancy. Figures 9 and 10 indicate no real change in PM2.5 concentrations over the years analysed.
Figure 9 - Trends in PM2.5 Concentrations at three Long-Running Monitoring sites, 2014-2023
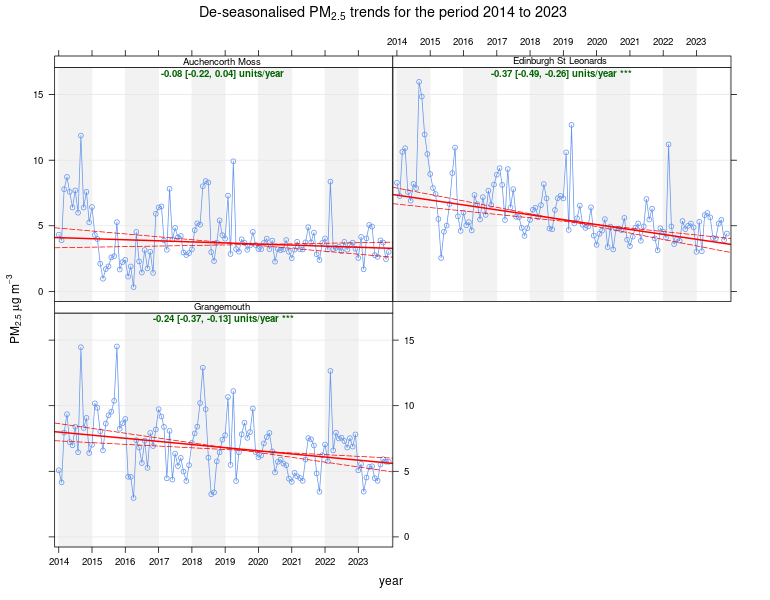
Figure 10 - Trends in PM2.5 Concentrations at nine Urban traffic monitoring sites, 2019-2023
Ozone (O3)
Rural Ozone
Three of Scotland’s rural air quality monitoring stations have been monitoring ozone for 32 years, 1986 – 2023. These are Bush Estate, Eskdalemuir and Strath Vaich. Figure 11 shows long-term trends in de-seasonalised monthly mean ozone (O3) concentrations at these three exceptionally long-running rural monitoring sites. Bush Estate and Eskdalemuir both show small but highly statistically significant increasing trends in rural ozone concentrations over this period. For Strath Vaich, there has been neither an increasing or decreasing trend over the same period with concentrations generally staying the same. The charts also show a significant amount of fluctuation; this may reflect the fact that ozone is formed by reactions involving other pollutant gases, in the presence of sunlight. Thus, ozone concentrations depend substantially on weather conditions. There is also evidence that the "hemispheric background" concentration of O3 has increased since the 1950s due to the contribution from human activities.
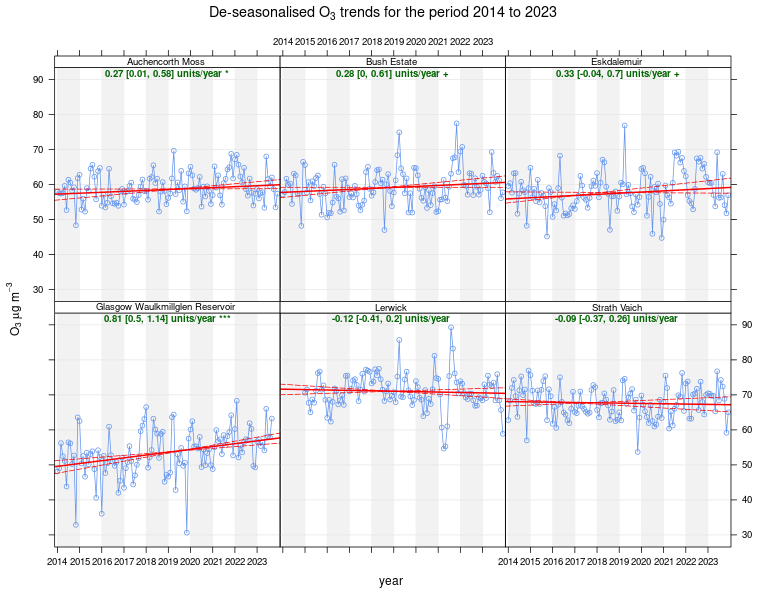
Six sites have been in operation for over 10 years. These are the above three sites, plus Auchencorth Moss, Glasgow Waulkmillglen Reservoir and Lerwick. Trends in ozone concentration at these six sites are shown in Figure 12. The ten-year trend analysis shows that four sites have increasing trends in O3 concentrations at varying levels of statistical significance. The other two sites (Lerwick and Strath Vaich) have slight decreasing trends with no statistical significance.
Figure 11 - Trends in O3 Concentrations at Long-Running Rural Sites, 1986–2023
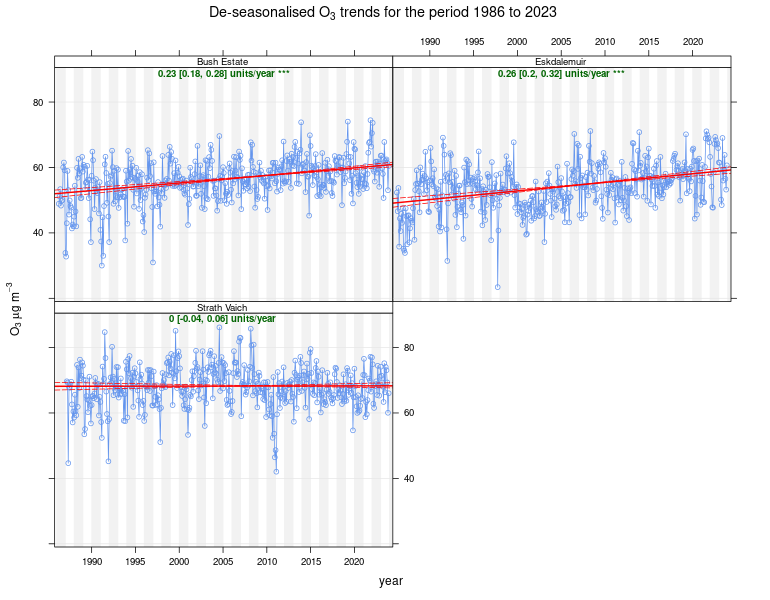
Figure 12 - Trends in O3 Concentrations at Six Long-Running Rural Sites, 2014–2023
Additional Trend Analysis
Additional analysis can be carried out on the SAQD monitoring data using analysis tools such as Openair. The Openair tools available on the Air Quality in Scotland website (http://www.scottishairquality.scot/data/openair) can be used to readily perform complex and innovative analysis of current and archived air pollutant data, allowing powerful data visualisation and interrogation capabilities. This annual analysis is also now provided in the local authority’s annual statistical reports in an interactive format. These an be found here https://www.scottishairquality.scot/laqm/statistics. For this annual report a snapshot of this analysis has been carried out for four NO2 automatic monitoring sites, located in the largest Scottish cities, that have historically measured exceedances. These sites are Aberdeen Wellington Road, Dundee Lochee Road, Edinburgh St Johns Road, and Glasgow Kerbside (Hope Street).
To see this additional analysis, visit Section 8 of the Scottish Air Quality Database Annual Report 2023.