
There are many factors that need to be considered when producing an air pollution forecast. This includes understanding the influence that meteorology has on air pollutant emissions and dispersion. Provided below are some examples of the weather forecast data that is included in the processes used to derive air pollution forecasts.
Five Days Air Mass Origins
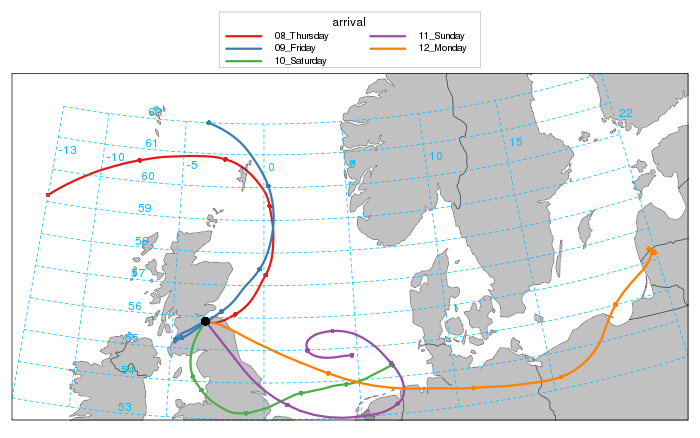
The air mass back-trajectory plot provided below shows data from the HYSPLIT forecast model (NOAA HYSPLIT). The plot illustrates where the air masses that affect Scotland have travelled from over the 96-hour period up to each of the upcoming forecast days. Air mass trajectories are an important factor when forecasting air pollution as they provide a useful indicator of the likelihood of transboundary air pollutants affecting Scotland. Air coming from the west is likely to be mainly clean, whilst from the south and east it can be picking up background emissions from mainland Europe and the UK. In some unusual situations, the air arriving in Scotland may even have picked up particulate matter from Saharan Dust storms or wildfires burning across southern Europe.
Meteorological Map
Weather conditions are an important factor in forecasting air pollution – they can affect pollutant emissions rates, chemical reactions in the atmosphere, and how air pollution is dispersed. For example, when the weather is cold and still, emissions from motor vehicles and building heating systems will be increased whilst dispersion will also be poor, allowing pollutants to build-up more rapidly. In the summer, warm weather and long hours of sunshine can increase the risk of photochemical ozone pollution forming. The Meteorological forecast maps, illustrated below and developed by Windy, provide a 3-day forecast for a variety of different meteorological elements. To interact with the maps select the Key located in the top right-hand corner to choose different weather elements. Select the play button to view the Meteorology conditions over the next 3 days. Please note that pollution data shown in the Windy maps is not supplied by Ricardo.