
Site Data
Aberdeen Anderson Dr
Latest Data: Updated 18/07/2026 22:00 GMT
| Pollutant | Index | Band | Concentration | Period |
|---|---|---|---|---|
| PM2.5 | 1 | LOW | 5 µg/m3 (Ref.eq) | 24 Hour mean |
| PM10 | 1 | LOW | 11 µg/m3 (FIDAS) | 24 Hour mean |
| PM1 | No Data | 3 µg/m3 (FIDAS) | 24 Hour mean | |
Mouse-over the graph to access further tools to analysis the data.
| Parameter | Parameter Name |
|---|---|
| PM10 | PM10 particulate matter (Hourly measured) |
| PM2.5 | PM2.5 particulate matter (Hourly measured) |
| PM1 | PM1 particulate matter (Hourly measured) |
Statistics for Aberdeen Anderson Dr
| Site Name | Aberdeen Anderson Dr |
|---|---|
| Site Type | Roadside |
| Easting, Northing | 392504.39, 804189.75 |
| Latitude, Longitude | 57.128567, -2.125447 |
| OS Grid Ref | |
| Address | |
| Site Comments | The Anderson Drive monitoring station is located between Broomhill Road and Headland Court and is sited approximately 4m from the kerbside. The sampling inlet is approximately 1.5m high. The traffic flow on Anderson Drive is approximately 35000 vehicles/day. The nearest road is the A90 which is 8m away from the station. |
| Monitoring Network: Scottish Automatic Urban Network | ||
|---|---|---|
| Parameter | Date Started | Date Ended |
| PM2.5 particulate matter (Hourly measured) | 20/07/2021 | |
| Modelled Wind Direction | 01/08/2010 | |
| Nitric oxide | 01/01/2005 | 07/06/2024 |
| Nitrogen oxides as nitrogen dioxide | 01/01/2005 | 07/06/2024 |
| PM1 particulate matter (Hourly measured) | 20/07/2021 | |
| Nitrogen dioxide | 01/01/2005 | 07/06/2024 |
| Modelled Temperature | 01/08/2010 | |
| PM10 particulate matter (Hourly measured) | 01/01/2005 | |
| Modelled Wind Speed | 01/08/2010 | |
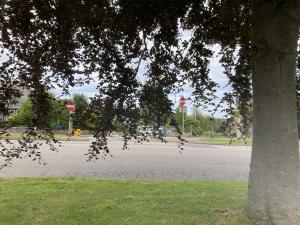
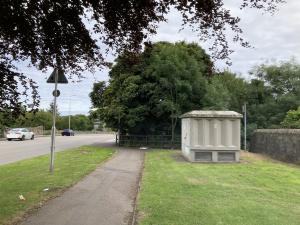
The photographs show the site itself, and views looking North, East, South and West.
-
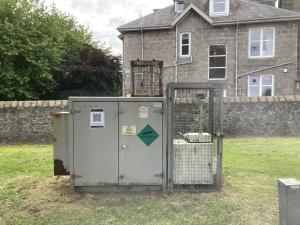
Monitoring Site Photo
-

View North
-
View East
-
View South
-

View West