
Site Data
Edinburgh St Leonards
Latest Data: Updated 18/07/2026 23:00 GMT
| Pollutant | Index | Band | Concentration | Period |
|---|---|---|---|---|
| O3 | 2 | LOW | 63 µg/m3 | 8 Hour mean |
| PM2.5 | 1 | LOW | 9 µg/m3 (Ref.eq) | 24 Hour mean |
| PM10 | 1 | LOW | 14 µg/m3 (FIDAS) | 24 Hour mean |
| SO2 | 1 | LOW | 1 µg/m3 | 15 Minute mean |
| NO2 | 1 | LOW | 8 µg/m3 | hourly mean |
| CO | No Data | 0.2 mg/m3 | 8 Hour mean | |
| NO | No Data | 2 µg/m3 | hourly mean | |
Mouse-over the graph to access further tools to analysis the data.
| Parameter | Parameter Name |
|---|---|
| O3 | Ozone |
| NO | Nitric oxide |
| NO2 | Nitrogen dioxide |
| SO2 | Sulphur dioxide |
| CO | Carbon monoxide |
| PM10 | PM10 particulate matter (Hourly measured) |
| PM2.5 | PM2.5 particulate matter (Hourly measured) |
Statistics for Edinburgh St Leonards
| Site Name | Edinburgh St Leonards |
|---|---|
| Site Type | Urban background |
| Easting, Northing | 326264.30, 673136.49 |
| Latitude, Longitude | 55.945589, -3.182186 |
| OS Grid Ref | |
| Address | |
| Site Comments | The nearest main road, Pleasance is approximately 35m away. |
| Monitoring Network: Scottish Automatic Urban Network | ||
|---|---|---|
| Parameter | Date Started | Date Ended |
| Benzene | 25/10/2005 | 20/09/2007 |
| Non-volatile PM10 (Hourly measured) | 10/07/2007 | 24/07/2019 |
| Nitrogen dioxide | 24/11/2003 | |
| Modelled Temperature | 01/08/2010 | |
| Sulphur dioxide | 24/11/2003 | |
| Volatile PM10 (Hourly measured) | 10/07/2007 | 24/07/2019 |
| Ozone | 24/11/2003 | |
| Modelled Wind Speed | 01/08/2010 | |
| Nitrogen oxides as nitrogen dioxide | 24/11/2003 | |
| Carbon monoxide | 24/11/2003 | |
| Non-volatile PM2.5 (Hourly measured) | 01/10/2008 | 24/07/2019 |
| PM10 particulate matter (Hourly measured) | 01/12/2003 | |
| Modelled Wind Direction | 01/08/2010 | |
| Nitric oxide | 24/11/2003 | |
| Volatile PM2.5 (Hourly measured) | 01/10/2008 | 24/07/2019 |
| PM2.5 particulate matter (Hourly measured) | 01/10/2008 | |
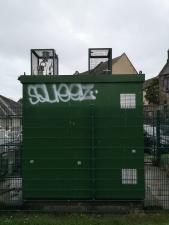
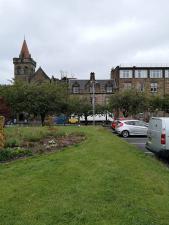
The photographs show the site itself, and views looking North, East, South and West.
-
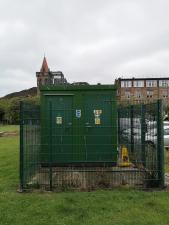
Monitoring Site Photo
-
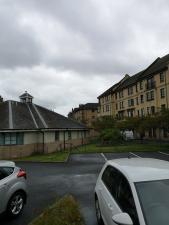
View North
-
View East
-
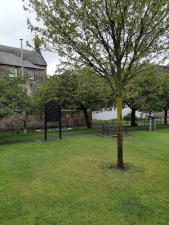
View South
-
View West