
Site Data
Glasgow Anderston
Latest Data: Updated 20/07/2026 22:00 GMT
| Pollutant | Index | Band | Concentration | Period |
|---|---|---|---|---|
| PM2.5 | 1 | LOW | 3 µg/m3 (Ref.eq) | 24 Hour mean |
| PM10 | 1 | LOW | 8 µg/m3 (FIDAS) | 24 Hour mean |
| NO2 | 1 | LOW | 10 µg/m3 | hourly mean |
| PM1 | No Data | 3 µg/m3 (FIDAS) | 24 Hour mean | |
| NO | No Data | 1 µg/m3 | hourly mean | |
Mouse-over the graph to access further tools to analysis the data.
| Parameter | Parameter Name |
|---|---|
| NO | Nitric oxide |
| NO2 | Nitrogen dioxide |
| PM10 | PM10 particulate matter (Hourly measured) |
| PM2.5 | PM2.5 particulate matter (Hourly measured) |
| PM1 | PM1 particulate matter (Hourly measured) |
Statistics for Glasgow Anderston
| Site Name | Glasgow Anderston |
|---|---|
| Site Type | Urban background |
| Easting, Northing | 257940.81, 665497.95 |
| Latitude, Longitude | 55.861667, -4.271389 |
| OS Grid Ref | |
| Address | |
| Site Comments | The nearest road is 40m from the site |
| Monitoring Network: Scottish Automatic Urban Network | ||
|---|---|---|
| Parameter | Date Started | Date Ended |
| Modelled Temperature | 01/08/2010 | |
| PM2.5 particulate matter (Hourly measured) | 29/11/2018 | |
| Wind Speed | 01/01/2005 | 02/11/2011 |
| Nitric oxide | 01/01/2005 | |
| Modelled Wind Speed | 01/08/2010 | |
| Sulphur dioxide | 01/01/2005 | 30/06/2016 |
| Non-volatile PM10 (Hourly measured) | 19/04/2011 | 28/11/2018 |
| Nitrogen dioxide | 01/01/2005 | |
| Modelled Wind Direction | 01/08/2010 | |
| Nitrogen oxides as nitrogen dioxide | 01/01/2005 | |
| Volatile PM10 (Hourly measured) | 19/04/2011 | 28/11/2018 |
| PM10 particulate matter (Hourly measured) | 01/01/2005 | |
| PM1 particulate matter (Hourly measured) | 29/11/2018 | |
| Wind Direction | 01/01/2005 | 02/11/2011 |
| Carbon monoxide | 01/01/2005 | 31/12/2014 |
The photographs show the site itself, and views looking North, East, South and West.
-
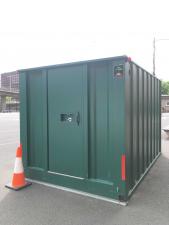
Monitoring Site Photo
-

View North
-

View East
-

View South
-

View West