
Site Data
Grangemouth
Latest Data: Updated 18/07/2026 23:00 GMT
| Pollutant | Index | Band | Concentration | Period |
|---|---|---|---|---|
| PM10 | No Data | 24 Hour mean | ||
| PM2.5 | No Data | 24 Hour mean | ||
| SO2 | 1 | LOW | 2 µg/m3 | 15 Minute mean |
| NO2 | 1 | LOW | 7 µg/m3 | hourly mean |
| NO | No Data | 0 µg/m3 | hourly mean | |
Mouse-over the graph to access further tools to analysis the data.
| Parameter | Parameter Name |
|---|---|
| NO | Nitric oxide |
| NO2 | Nitrogen dioxide |
| SO2 | Sulphur dioxide |
| PM10 | PM10 particulate matter (Hourly measured) |
| PM2.5 | PM2.5 particulate matter (Hourly measured) |
Statistics for Grangemouth
| Site Name | Grangemouth |
|---|---|
| Site Type | Urban industrial |
| Easting, Northing | 293829.88, 681020.65 |
| Latitude, Longitude | 56.010319, -3.704399 |
| OS Grid Ref | |
| Address | |
| Site Comments | The nearest road is approximately 50 metres from the station, and is a residential access road (Inchyra Rd). |
| Monitoring Network: Scottish Automatic Urban Network | ||
|---|---|---|
| Parameter | Date Started | Date Ended |
| Benzene | 06/03/2002 | |
| 1,3-butadiene | 26/05/2003 | |
| Volatile PM10 (Hourly measured) | 16/04/2009 | 06/06/2018 |
| PM10 particulate matter (Hourly measured) | 01/01/2001 | |
| Modelled Wind Speed | 01/08/2010 | |
| Carbon monoxide | 17/01/2003 | 30/09/2007 |
| Non-volatile PM2.5 (Hourly measured) | 03/12/2008 | 06/06/2018 |
| PM2.5 particulate matter (Hourly measured) | 03/12/2008 | |
| Modelled Wind Direction | 01/08/2010 | |
| Nitric oxide | 01/01/2001 | |
| Volatile PM2.5 (Hourly measured) | 03/12/2008 | 06/06/2018 |
| Sulphur dioxide | 01/01/2001 | |
| Non-volatile PM10 (Hourly measured) | 16/04/2009 | 06/06/2018 |
| Nitrogen dioxide | 01/01/2001 | |
| Modelled Temperature | 01/08/2010 | |
| Nitrogen oxides as nitrogen dioxide | 01/01/2001 | |
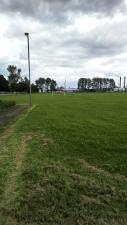
The photographs show the site itself, and views looking North, East, South and West.
-

Monitoring Site Photo
-
View North
-

View East
-

View South
-

View West