
Site Data
Lerwick
Latest Data: Updated 18/07/2026 21:00 GMT
| Pollutant | Index | Band | Concentration | Period |
|---|---|---|---|---|
| O3 | 2 | LOW | 59 µg/m3 | 8 Hour mean |
| NO2 | 1 | LOW | 1 µg/m3 | hourly mean |
| SO2 | 1 | LOW | 13 µg/m3 | 15 Minute mean |
| NO | No Data | 1 µg/m3 | hourly mean | |
Mouse-over the graph to access further tools to analysis the data.
| Parameter | Parameter Name |
|---|---|
| O3 | Ozone |
| NO | Nitric oxide |
| NO2 | Nitrogen dioxide |
| SO2 | Sulphur dioxide |
Statistics for Lerwick
| Site Name | Lerwick |
|---|---|
| Site Type | Rural |
| Easting, Northing | 445350.77, 1139689.93 |
| Latitude, Longitude | 60.139220, -1.185319 |
| OS Grid Ref | |
| Address | |
| Site Comments | 2.5km SW of Lerwick centre with some housing less than 1 km from the site. 60 08 21N 01 11 08 W |
| Monitoring Network: Scottish Automatic Rural Network | ||
|---|---|---|
| Parameter | Date Started | Date Ended |
| Sulphur dioxide | 16/10/2012 | |
| Modelled Wind Direction | 01/08/2010 | |
| Nitric oxide | 16/10/2012 | |
| Nitrogen oxides as nitrogen dioxide | 16/10/2012 | |
| Nitrogen dioxide | 16/10/2012 | |
| Modelled Temperature | 01/08/2010 | |
| Ozone | 25/05/2005 | |
| Modelled Wind Speed | 01/08/2010 | |
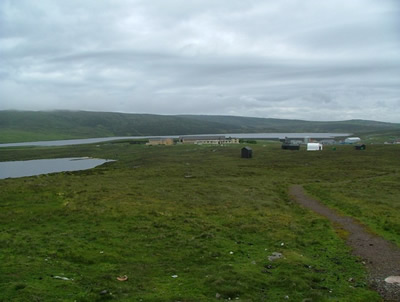
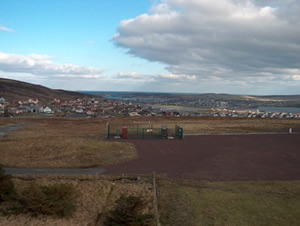
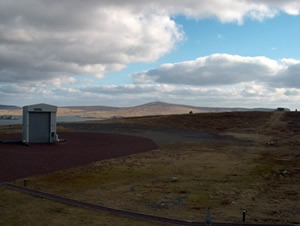
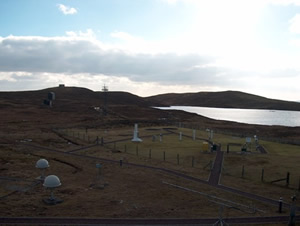
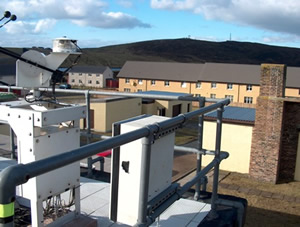
The photographs show the site itself, and views looking North, East, South and West.
-
Monitoring Site Photo
-
View North
-
View East
-
View South
-
View West